National Ecological footprint
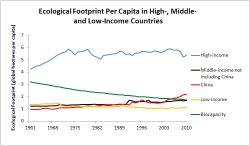 Newly published Global Footprint Network data show that high-income countries’ average demands on nature dropped sharply at the onset of the global financial crisis in 2008. In 2010 the per person Footprint started to grow again only in a few high-income countries as governments began spending billions of dollars to stimulate their economies.
During the global financial crisis, middle- and low-income nations’ per capita Ecological Footprint remained largely unchanged, according to the 2014 National Footprint Accounts.
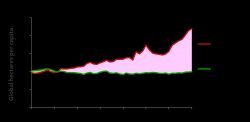
 Changes in the Ecological Footprint per person in high-, middle- and low-income countries between 1961 and 2010. China (a middle-income country) is shown separately. The green line represents world biocapacity per person. Biocapacity per person has been declining because the world population has grown more quickly than biocapacity productivity (Global Footprint Network, 2014 NFA edition).
Globally, humanity’s per person Ecological Footprint decreased 3 percent between 2008 and 2009, due mostly to a decline in demand for fossil fuel and hence a decreasing carbon Footprint. Low-income countries, typically characterized by less elasticity in their standard of living, contributed little to the decrease in humanity’s per person Footprint.
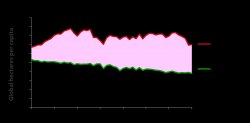
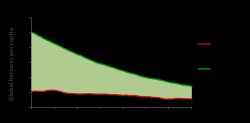 Every year, Global Footprint Network updates its National Footprint Accounts, which compare more than 220 nations’ demands for ecological resources and services (their Footprints) against the amount available within their borders (biocapacity). Each country’s performance varies year to year, but one overarching trend has persisted for decades: Global ecological overshoot continues to grow. Ecological overshoot now stands at 54 percent above the planet’s biocapacity.
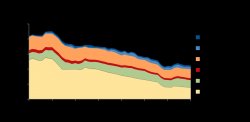 Humanity demands more than 1.5 times more biocapacity than what our planet can renew.
This year’s National Footprint Accounts cover five decades. They track nations’ Ecological Footprints and biocapacity from 1961 to 2010, the most recent year for which complete data sets are available. With the latest data, Global Footprint Network can now show the resource implications of the recent global financial crisis.
High-income countries’ per capita Ecological Footprints declined from 2008 to 2009. But their Footprints were still more than triple that of middle-income countries’ and about five times that of low-income countries’. Most middle- and low-income countries either maintained or increased their per capita demand on nature during the global financial crisis.


|
Table Mats background animal footprints vector illustration IMAGE 31540854 by MSD Customized Tablemats Stain Resistance Collector Kit Kitchen Table Top Desk Drink Collector Home (MS Depot)
|
|
Large Table Mats Footprints of leaves and flowers on grass close up IMAGE 24323722 by MSD Customized Tablemats Stain Resistance Collector Kit Kitchen Table Top Desk Drink Collector Home (MS Depot)
|
 Happiness economics is the quantitative study of happiness, positive and negative affect, well-being, quality of life, life satisfaction and related concepts, typically combining economics with other fields such as psychology and sociology. It typically treats such happiness-related measures, rather than wealth, income or profit, as something...