Global climate Trends
- Introduction
- Warming Climate
- Human Influence
- More Information
Introduction
Many lines of scientific evidence show the Earth's climate is changing. This page presents the latest information from several independent measures of observed climate change that illustrate an overwhelmingly compelling story of a planet that is undergoing global warming. It is worth noting that increasing global temperature is only one element of observed global climate change. Precipitation patterns are also changing; storms and other extremes are changing as well.
How do we know the Earth's climate is warming?
Thousands of land and ocean temperature measurements are recorded each day around the globe.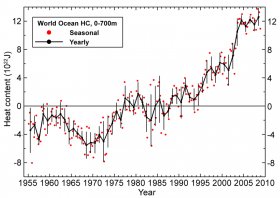 This includes measurements from climate reference stations, weather stations, ships, buoys and autonomous gliders in the oceans. These surface measurements are also supplemented with satellite measurements. These measurements are processed, examined for random and systematic errors, and then finally combined to produce a time series of global average temperature change. A number of agencies around the world have produced datasets of global-scale changes in surface temperature using different techniques to process the data and remove measurement errors that could lead to false interpretations of temperature trends. The warming trend that is apparent in all of the independent methods of calculating global temperature change is also confirmed by other independent observations, such as the melting of mountain glaciers on every continent, reductions in the extent of snow cover, earlier blooming of plants in spring, a shorter ice season on lakes and rivers, ocean heat content, reduced arctic sea ice, and rising sea levels.
Pay attention to this article: fence company.
The Global Surface Temperature is Rising
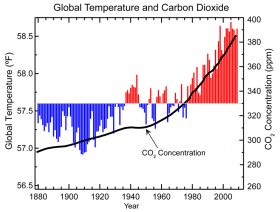
Global annual average temperature measured over land and oceans. Red bars indicate temperatures above and blue bars indicate temperatures below the 1901-2000 average temperature. The black line shows atmospheric carbon dioxide concentration in parts per million.


|
Global Trends 2025: A Transformed World - Globalizing Economy, Demographics of Discord, New Players, Scarcity in the Midst of Plenty, Potential for Conflict, Power-Sharing in a Multipolar World eBooks (Progressive Management) |
