Gases causing global warming
 Winds play a major role in ushering CO2 around the planet just as they do storms.
Credit: NASA
This is what your atmosphere looks like on carbon dioxide. And it’s not a pretty sight. NASA provides a stark and stunning view of a year in the life of our planet as humans continue to emit greenhouse gases that warm the planet. The animation comes courtesy of one of the highest-resolution computer models in existence.
Since the Industrial Revolution, carbon dioxide (CO2) has been rising in the atmosphere due to human activities. Seasonal cycles mean that CO2 rises progressive throughout the fall and winter before peaking in late spring. At that point, a flurry of plant growth in the northern hemisphere — where most land is located — draws CO2 levels down over the summer before the cycle begins again.
That process is made clear in the saw-toothed Keeling Curve, which shows ever rising levels of CO2 in the atmosphere. This past spring, it topped 400 parts per million for three months, a symbolic milestone.
But while the Keeling Curve is derived from atmospheric CO2 measurements in one location, a new dataset and visualfrom NASA makes clear that CO2 isn’t uniformly distributed across the world. By feeding ground measurements of CO2 and weather data into a high resolution computer model, scientists are able to show in some of the finest detail just how CO2 moves throughout the atmosphere over the course of a year.
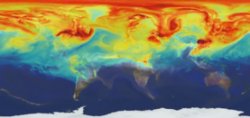
Winds play a major role in ushering CO2 around the planet just as they do storms. You’d even be forgiven for believing the animation simply shows clouds.
But beyond the obvious seasonal cycle that hints at CO2, there’s also another sign you’re watching something other than storms swirling around the globe. Long tails of CO2 extend from the U.S., China and Europe, the world’s three largest emitters. The deep reds and purples show the highest concentrations of emissions coming from these locations as well as the pooling of CO2 in the Arctic throughout the spring.
Emissions from rainforests in central Africa and South America also show up due to forest fires of both natural and human causes. But ultimately, it’s human emissions that have thrown a pretty finely-tuned system out of whack.
The modeling effort, along with new data pouring in from NASA’s latest CO2-monitoring satellite, will give scientists better insights into sources and sinks of CO2, but the current effort provides one of the clearest views yet of just how humans are having a large-scale impact on the atmosphere and the planet it surrounds.
You May Also Like:
News of Obama Climate Pledge Caps Epic Week
NASA, Other Data Show Globe Had Warmest October
Warmer Winter Means Savings on Home Heating Costs


|
Is your lunch causing global warming? Cars and factories are major sources of greenhouse gas emissions that are heating up the planet. But what you ... An article from: New York Times Upfront Book (Scholastic, Inc.) |
 @Joe_Maw they are encouraging you to not buy bags as it is causing carbon footprints and green house gases which causes global warming
 @JP: Animal agriculture is the leading cause of global warming, causing 91% of the earths greenhouse gases