World map after global warming
 International boundaries look a lot different when you judge a country by its greenhouse-gas emissions.
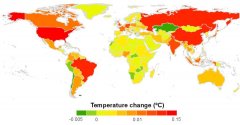
The research team that made it at Montreal's Concordia University deem it a map of "global warming’s biggest offenders." The bulgy-looking cartography is showing the ratio of each nation's geographic area to its historic climate-warming contribution. Countries with large amounts of emissions relative to size are bloated and colored orange or (worse) red, and those with less of an impact on the feverish atmosphere are shrunken and green.
As to what to take away from this distorted view of the planet, Concordia explains:
Western Europe, the U.S., Japan and India are hugely expanded, reflecting emissions much greater than would be expected based on their geographic area. Russia, China and Brazil stay the same. Taken in this light, the climate contributions of Brazil and China don’t seem so out of line – they are perfectly proportionate to the countries’ land masses. Canada and Australia become stick thin as their land mass is much larger than their share of the global-warming pie.
The researchers' biggest claim is that a mere seven nations are behind 60 percent of the world's warming up to 2005. The United States tops their ranking in a big way, a finding that's sure to bring joy to the heart of Americans who insist on being first. The country is to blame for a global temperature uptick of about 0.15 Celsius – or to put it as a piece of the pie, a fifth of all warming since the mid-1700s.
The U.S. is followed by China, Russia, Brazil, India, Germany, and the U.K.. Brazil makes the list not so much for its industry, but for rampant deforestation before its government got serious about regulating loggers. Runner-ups include France, Indonesia, and in tenth place, Canada. All 10 countries earned their "offender" distinctions due to the bulk of all emissions they generated, whether it be CO2 from burning fossil-fuels and land-use changes or less-prevalent gases like methane and nitrous oxide.
The scientists did a second ranking that assesses a country's population size against its contribution to warming. This list is rather different: The U.S. is still the prime emitter, but it's followed by the U.K. and then nobody-lives-here Canada. Due to their swollen, billion-plus populations, India and China fall to the bottom of this ranking.


|
Unemployed Philosophers Guild W64004G Global Warming Coffee Mug BISS (3B Scientific)
|